Running a Shopify store without checking your analytics is like trying to steer a ship blindfolded.
Shopify Analytics is your control panel. It tracks your sales, traffic, customer behavior, and conversion rates all in one place. It tells you what’s working, what’s wasting your time, and where your biggest growth opportunities are hiding.
Most sellers glance at surface-level numbers, maybe total sales or traffic, and then move on. But that barely scratches the surface. I’ve worked with sellers who were stuck for months, constantly launching ads and tweaking products without seeing results.
The turning point came when they finally started digging into their Shopify Analytics dashboard. Within weeks, they were making sharper decisions, redirecting ad spend, fixing underperforming listings, and launching offers that actually converted.
Shopify Analytics gives you data and direction. The moment you start treating it like the command center of your business, that’s when your store starts running smarter, not harder.
-
Shopify Analytics helps you track key metrics like sales, traffic, and customer behavior so you can make better business decisions.
-
Upgrading your Shopify plan unlocks deeper insights like custom reports, advanced segmentation, and detailed sales attribution.
-
Features like cohort analysis, product analytics, and real-time tracking are often ignored but crucial for long-term growth.
-
Pairing Shopify Analytics with tools like GA4, Klaviyo, and Hotjar gives you a clearer view of your entire customer journey.
-
Reviewing your analytics weekly helps you spot problems early, refine your strategy, and stay focused on what’s really working.
Why Shopify Analytics Matters
The difference between a Shopify store that scales and one that stalls is how well the seller understands and uses their data. I’ve seen it play out up close. One of my clients was selling handmade skincare products.
Her store had steady traffic and a loyal Instagram following, but sales flatlined for three straight months. She was tweaking product photos, running random discounts, and spending money on ads without really knowing what was working. Once we started digging into her Shopify Analytics, the story changed.
We noticed her highest-traffic product page had a terrible conversion rate. The average order value was lower than the store’s profit margin could handle. Worse, most of her returning customers were only buying once a year, usually during promotions.
So we adjusted the product bundles, rewrote the copy to match what customers were actually searching for, and started tracking the retention rate week by week. Within two months, her AOV went up by 18%, and repeat purchases doubled.
Shopify Analytics made it obvious what needed fixing. And once we had that clarity, the decisions became easier, and the results followed. Whether you’re just starting or you’ve been selling for years, using data to guide your moves isn’t optional. It’s the only way to grow with confidence.
What Shopify Analytics Tracks and Why You Should Care
Shopify Analytics gives you access to a dashboard that tracks essential metrics:
- Total sales
- Average order value (AOV)
- Conversion rate
- Sales by product, channel, and location
- New vs. returning customers
- Traffic sources and behavior
Think of these metrics as your store’s vital signs. They tell you if your business is healthy, where it’s strong, and where it’s struggling.
Let’s say your conversion rate is low despite high traffic. That’s a red flag. Maybe your product page isn’t convincing, or maybe you’re attracting the wrong kind of visitors. On the flip side, if your AOV suddenly dips, it could mean customers are skipping your bundles or higher-ticket items.
I’ve had clients who only realized their top-selling product was actually their least profitable once they reviewed sales by product, and they’d been promoting it for months.
You also get insight into where your sales are actually coming from. Are your customers mostly on mobile or desktop? Is TikTok sending buyers, or just browsers? Are certain countries converting better than others?
You don’t have to guess. Shopify Analytics gives you the full picture so you can stop making assumptions and start making decisions based on facts.
It’s one of the few tools that lets you respond in real time. When a promotion spikes sales in one channel but flops in another, you’ll know within hours, not weeks. And that kind of speed? It matters when you’re running an online store.
Shopify Analytics by Plan: What You Actually Get
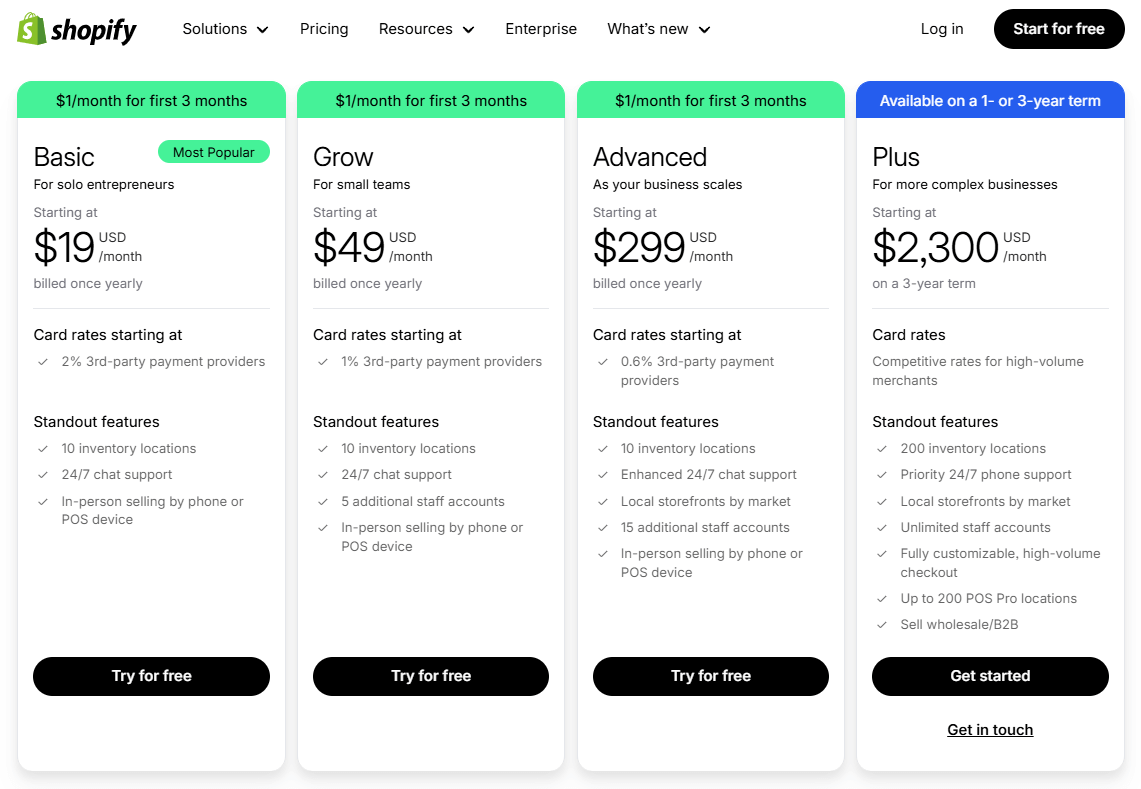
Shopify’s data features depend on your subscription plan. If you’re on Basic Shopify, you’ll get an overview of your sales, traffic, and top products. But the more you pay, the more insights you unlock.
- Basic Shopify: Simple dashboard with basic reports
- Shopify (Standard): Professional reports and customer behavior data
- Advanced Shopify: Custom reports, detailed analytics
- Shopify Plus: Full access, including ShopifyQL Notebooks and deeper integrations
Each plan gives you a different level of control over your store’s performance insights. On Basic Shopify, you’re working with a clean dashboard that covers the basics—total sales, traffic trends, and your best-selling products. That’s fine for getting started, but you’ll hit a ceiling fast.
On the Shopify (Standard) plan, you unlock more detailed reports like sessions over time, customer behavior, and sales breakdowns by channel.
That means you can start spotting patterns, like whether your mobile users convert better than desktop users, or which social media platforms are sending the most valuable traffic.
Once you hit the Advanced Shopify tier, things get more powerful. You can build custom reports tailored to your business needs.
One of my clients uses these to track specific product bundles during promotions. Instead of sorting through general sales data, they can zero in on exactly what they need and adjust strategies on the fly.
Shopify Plus takes it even further. With features like ShopifyQL Notebooks, you can query data like a pro. You get advanced segmentation, real-time forecasting, and integrations with BI tools.
I’ve seen clients use this to automate weekly reporting, sync data to ad platforms, and build dashboards that even their investors can understand.
If you’re serious about growth, upgrading to Advanced or Shopify Plus is worth it for the reporting alone. Many of my clients on Plus run custom reports weekly to plan inventory, retarget ads, and segment high-LTV customers.
They know who their best buyers are, where they came from, and what offer brought them back, and that knowledge pays off fast.
Features Most Sellers Ignore (But Shouldn’t)
You might be familiar with the general dashboard, but there are hidden insights in Shopify Analytics that most sellers overlook, and those overlooked metrics can quietly cost you growth and revenue.
Customer Cohort Analysis
This lets you track groups of customers over time. You can see how long they stick around after their first purchase, when they’re most likely to reorder, and how different campaigns affect loyalty.
One of my clients used this to figure out that customers acquired through TikTok stayed active longer than those from Google Ads, so they doubled down on TikTok and saw their lifetime value (LTV) increase by over 20% in three months.
Live View
It’s like watching your store’s heartbeat in real time. You can see how many people are browsing your store at any moment, what pages they’re on, and whether any of them are about to check out.
I’ve seen clients use Live View during product launches and flash sales to monitor performance on the spot, and pivot quickly if traffic was heavy but conversions stalled.
Sales Attribution
Not all traffic is equal. This feature shows you which marketing channels are actually leading to purchases, not just page views.
One seller I worked with thought Instagram was their biggest moneymaker because of all the likes and clicks. But once they looked at attribution data, they saw email campaigns brought in twice the revenue with half the effort.
Product Analytics
This goes beyond just knowing your best-sellers. You get a clear view of which products bring in profit and which ones quietly hurt your margins.
I’ve had clients who were promoting a product heavily, only to find out that after discounts, returns, and shipping, they were barely breaking even. Product Analytics helped them switch focus and stop the silent loss.
Returning Customer Rate
This metric reveals how well you keep your buyers coming back. Shopify data shows that returning customers are 67% more likely to convert and spend 33% more than new customers.
That’s a big deal. And yet, most sellers don’t track this closely. I encourage all my clients to review this rate monthly and treat it as a health check for their brand loyalty strategy.
These features aren’t hidden behind complicated dashboards. They’re there, waiting to be used. When sellers finally tap into them, the way they manage their store shifts. They stop guessing. They start refining. And the numbers begin to move in the right direction.
What’s New in Shopify Analytics (2025 Update)
This year, Shopify introduced several powerful updates to their analytics tools, and they’re designed to help you work faster, see clearer, and act with more precision.
Shopify Insights Dashboard
This new view gives you a clean, all-in-one snapshot of how your store is performing. It pulls together sales trends, customer behavior, and inventory movement so you can quickly spot what’s picking up and what’s slowing down.
What makes it even more useful is the built-in suggestions. If your sales dip on a high-traffic product, it might recommend reviewing your price or updating your photos. It’s like having a second pair of eyes looking at your store performance every day.
Google Analytics 4 (GA4) Integration
The GA4 upgrade has made tracking much more detailed. You get more accurate ecommerce events, like when users scroll, click, add to cart, or begin checkout. This helps you understand exactly where your buyers lose interest.
One client of mine used this integration to identify a drop-off right after visitors reached the shipping page. That led to a free shipping threshold strategy that bumped conversions by 12% in a week.
ShopifyQL Notebooks (for Plus)
For sellers using Shopify Plus, this feature is one of the most efficient ways to analyze data without bouncing between apps. You can write SQL-style queries to generate reports on things like repeat purchase rate, discount performance, or abandoned carts.
It saves time and delivers deeper insights. One of my Plus clients uses it to automatically pull weekly performance reports segmented by traffic source, something that used to take her hours.
Enhanced filtering, customizable reports, and better visualization tools
Shopify has also made it easier to zoom in on exactly what matters to your business. You can filter by date, channel, region, product type, whatever slice of data you want. The graphs are cleaner, the exports are faster, and the reporting layout feels much more intuitive.
With these improvements, you’re turning data that you’ve collected it into clear, confident action.
You’ll spend less time digging and more time deciding what to do next. Whether you’re managing a lean team or running a growing brand, this level of clarity can make a big difference in how quickly you move.
How to Use Shopify Analytics to Grow Smarter
Once you know what your data is telling you, the next step is to do something with it. That’s where the real value shows up.
When my clients started using Shopify Analytics not just to observe trends but to test, adjust, and respond, things moved faster. Revenue grew, margins widened, and their marketing decisions made more sense.
Here’s how they used Shopify Analytics to build real momentum:
Boosting Conversion Rates
One client had decent traffic, but their sales weren’t adding up. After comparing product views with actual purchases and layering that with heatmap data, we realized the descriptions weren’t doing the product justice.
They rewrote them to match what customers were searching for clearer benefits, fewer distractions, stronger calls to action. Within a month, conversions lifted by 17%. That’s the kind of change that stacks up over time.
Improving Retention
Another seller tracked customer cohorts and noticed a drop-off after the first purchase. Instead of leaving it to chance, they added a simple “Thank You” email with a small incentive sent on day 10.
That one message increased repeat purchases by 22%. It wasn’t flashy. It was timely, based on actual customer behavior, and built directly from what the data revealed.
Refining Ad Spend
One of my clients was spending heavily on Google Ads but barely breaking even. When we pulled up the sales attribution report in Shopify Analytics, it showed that Instagram drove fewer clicks, but the customers who came from there spent more and returned more often.
They adjusted their ad budget accordingly and cut their CPA by nearly 40%. Same budget, better outcome.

Planning Seasonal Sales
A home décor seller reviewed their Q3 and Q4 analytics from the previous year and found that certain SKUs surged right before Halloween, but others didn’t move at all.
With that insight, they built a leaner campaign, pushed only the proven products, and timed their promotions more strategically. That season, they cleared inventory faster and at a higher margin.
This is what it looks like when data guides your decisions. You plan smarter. You target the right people at the right time.
You respond to what’s actually happening in your store, not what you assume is happening. And that’s when growth stops feeling like a gamble and starts looking like a strategy.
Combine Shopify Analytics with Other Tools
Shopify data becomes even more powerful when paired with the right tools, especially when you want to dig deeper or connect the dots between platforms.
It’s one thing to know your conversion rate. It’s another to know why it’s moving and how each part of your funnel is contributing to that shift.
Here’s how I’ve seen sellers use these tools alongside Shopify Analytics to get a clearer picture and better results:
Google Analytics 4 for detailed traffic behaviour
GA4 breaks down what visitors do before and after landing on your store. You’ll see how long they stay, what pages they explore, and where they bounce.
One seller I worked with used this to identify that most of their traffic from Pinterest was dropping off at the product page. That insight led to a faster-loading mobile design and better image placement, which lowered their bounce rate by over 25%.
Klaviyo for email segmentation based on buying habits
Shopify tells you who bought what and when. Klaviyo lets you act on it. You can set up flows for specific behaviors: first-time buyers, high spenders, frequent browsers, and cart abandoners.
One of my clients used this to trigger a VIP offer for customers who had made three purchases within 90 days. Their repeat purchase rate spiked within two weeks.
Meta Pixel for ad retargeting on Facebook and Instagram
Meta Pixel tracks what users do on your store after clicking from an ad. Paired with Shopify’s attribution data, this helps you figure out which audiences are worth retargeting, and which are draining your budget.
You can get as specific as “show this ad to people who viewed this product but didn’t add it to cart.” That level of targeting adds precision to every campaign.
Hotjar to visualize user interaction through heatmaps
Data tells you what’s happening. Hotjar shows you how. You can watch recordings of user sessions, track where they click, and see which parts of your page get ignored.
This helped one seller I worked with realize that nobody was seeing their free shipping banner because it was buried beneath a full-screen image slider. A simple layout shift improved engagement across the board.
Peel Analytics for deeper cohort reporting
Peel takes your Shopify customer data and builds detailed cohort views automatically. You can track how different segments behave over time, which helps with forecasting and personalized marketing. It saves hours of manual reporting and helps you move faster with confidence.
The goal is to build a full-picture feedback loop: who your buyers are, how they behave, and what they respond to across channels. When all your tools speak the same language, you get clarity. And with clarity comes better decisions, sharper campaigns, and faster growth.
Mistakes to Avoid with Shopify Analytics
Here are the most common mistakes I’ve seen sellers make:
1. Only checking analytics when sales are slow
Waiting for a dip in revenue to check your dashboard is like checking your car engine only after it breaks down.
Your analytics should be reviewed on a regular schedule, not just when you’re panicking. When you track consistently, you start to notice patterns early and avoid the need for damage control.
2. Chasing high traffic instead of high conversions
More visitors don’t always mean more buyers. I’ve seen sellers celebrate a spike in sessions without realizing those clicks came from low-intent sources.
The focus should be on traffic that converts, visitors who are actually interested in what you’re offering, not just curious passersby.
3. Misreading bounce rate as always bad (it’s context-dependent)
A high bounce rate on your homepage might be a concern. But a high bounce rate on your FAQ page? Maybe not.
I’ve had clients stress over bounce rate without asking what page the user landed on or what action they took. Sometimes a user finds exactly what they need, gets the info, and bounces, and that’s not always a failure.
4. Not setting benchmarks or reviewing trends week-over-week
Without clear goals or comparisons, it’s hard to know if your numbers are actually improving.
I always advise my clients to set simple weekly benchmarks, even if it’s just tracking conversion rate or average order value over the last four Mondays. That habit alone builds awareness and keeps you grounded in data, not assumptions.
5. Reacting emotionally to dips instead of investigating root causes
It’s easy to panic when revenue drops or traffic slows down. I’ve seen sellers slash prices or pour money into ads as a quick fix, only to make things worse.
The better move is to pause, dig into your analytics, and figure out why it happened. Did a product sell out? Did a high-performing ad get paused? Did your main traffic source shift? The data usually holds the answer.
Analytics only help if you know what you’re looking at, and if you’re consistent. Make it part of your weekly routine. Just 30 minutes a week can help you catch problems early, double down on what’s working, and run your store with a lot more confidence.
Why You Need to Treat Shopify Analytics Like a Business Partner
If you’re treating Shopify Analytics like a side feature, you’re wasting one of the most valuable tools you have. It’s not just data. It’s business intelligence. It gives you clarity when things feel uncertain and direction when you’re not sure what move to make next.
Every time you log in, you’re looking at the story of your store: what’s working, what’s not, and where to pivot.
It shows you how customers behave, what grabs their attention, and where they lose interest. That kind of insight is something most sellers overlook while chasing trends or relying on gut decisions.
The sellers who make it long-term are the ones who stay close to their numbers. They track revenue, test changes, measure impact, and use Shopify Analytics to learn something new every week.

I’ve worked with shop owners who turned things around completely just by getting into the habit of checking their reports every Friday.
No fancy dashboards, no custom scripts, just one hour of reviewing sales patterns, traffic sources, and customer behavior. One client doubled their monthly revenue in six months by doing exactly that.
You don’t need to be a data scientist. You don’t need complicated tools. You just need the discipline to look, think, and respond. When you start treating your Shopify Analytics dashboard like a real business partner, one that reports, tracks, and gives you the truth, you’ll start making sharper decisions.
It already knows more than you think. And if you pay attention, it will guide you toward smarter growth, more efficient marketing, and stronger customer relationships. The next level of your store isn’t somewhere out there. It’s likely already inside your dashboard, waiting to be noticed.